16 November 2026
What is an obstacle height map, and why it can rule out a turbine position
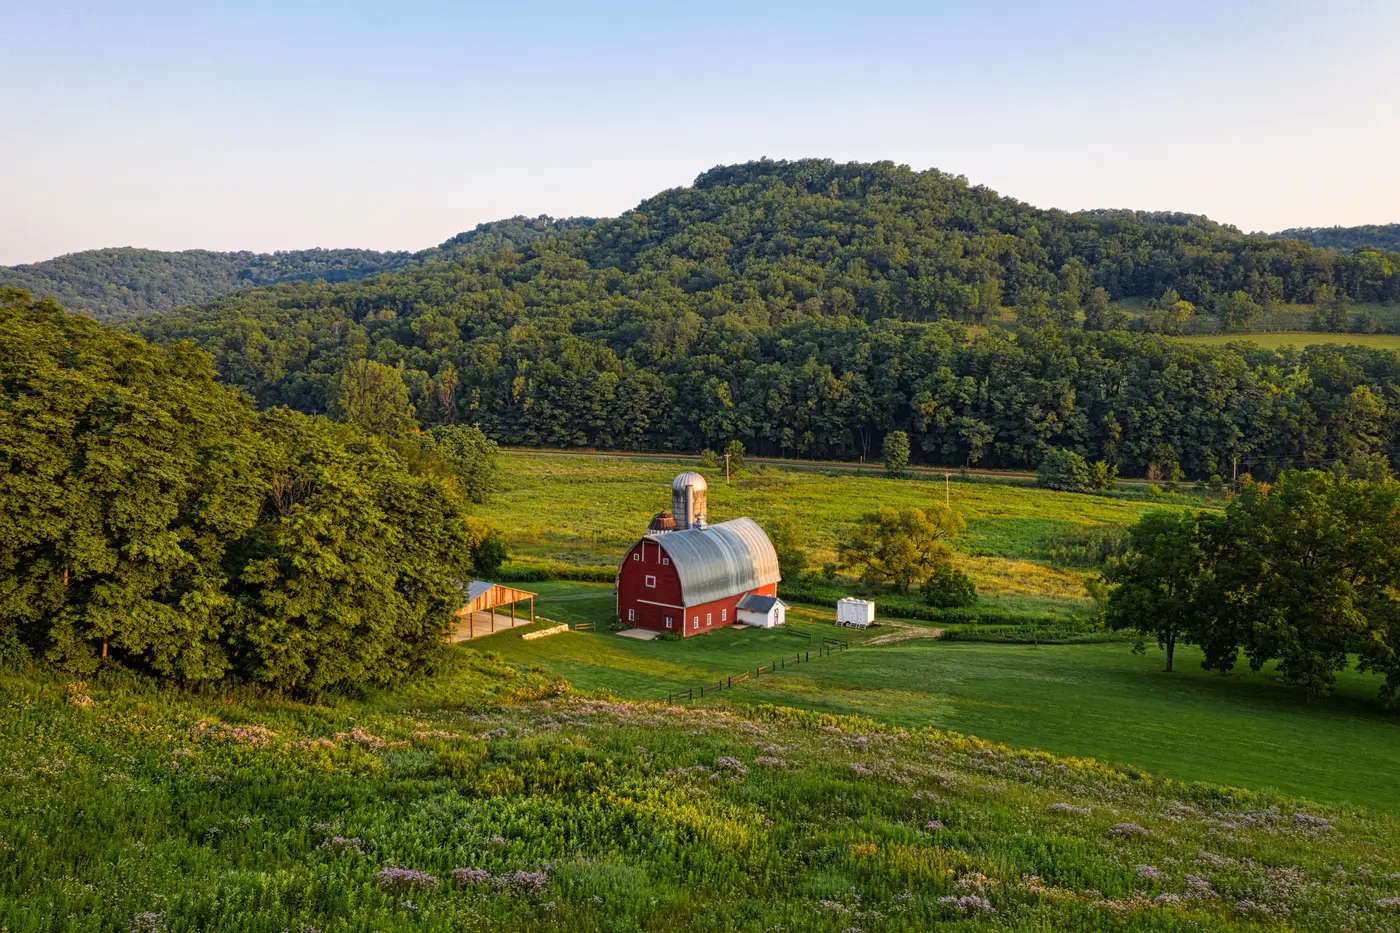
An obstacle height map is a layer that puts a number on everything standing above the ground near a candidate turbine position. Tree lines, farm buildings, grain silos, transmission towers, the occasional barn that's been there since 1950. Each one gets a height relative to the terrain around it, not just a dot on a map saying "obstacle here."
That number matters because turbine siting isn't just about wind resource. A ridge can have a great wind rose and still fail the moment someone measures the distance from the nearest rotor swept area to a residence, a road, or a tree line taller than the setback rule allows.
What the map actually shows
Most siting teams start with a wind resource screen: mesoscale data, maybe a reanalysis dataset, something that says "this ridge is worth a look." That screen tells you almost nothing about what's standing on the ridge.
An obstacle height map fills that gap. It's derived from stereo very-high-resolution imagery, the kind of imagery pair that lets you calculate elevation differences across a scene rather than just look at a flat picture. From that you get three things layered together: slope, surface roughness, and obstacle height. Slope tells you if the terrain itself is buildable. Roughness tells you what kind of ground cover you're dealing with, pasture versus scrub versus dense tree canopy. Obstacle height gives the height of whatever is poking up out of that ground cover, measured against the local terrain around it rather than against sea level.
Put those three together and a desk review starts looking a lot like a site walk, minus the truck.
Setbacks, tree lines, and why a position gets disqualified
Every jurisdiction has some version of a setback rule: a minimum distance between a turbine (or its rotor swept area) and the nearest building, road, property line, or occupied structure. Some rules also factor in tree line height, because a mature tree line can function like a building for wake and noise purposes even though nobody lives in it.
Here's where obstacle height screening earns its keep. A candidate position might clear every building setback on the parcel map and still fail because there's a 20-meter tree line 150 meters upwind that nobody flagged, or a grain elevator just outside the property boundary that wasn't in the county's building footprint layer. County GIS layers are usually built for tax assessment, not turbine siting. They miss things. An obstacle height map built from current imagery measures what's standing there now, independent of what the assessor's database happens to have on file.
This is also where surface roughness earns its keep on the met mast question. A ridge with low roughness and a clean obstacle profile is worth the cost of a mast and a year of data logging. A ridge where every third candidate position sits inside a tree-line setback, or backs up against a building nobody had on the map, is a ridge you can rule out from a desk before committing mast budget to it.
Why this matters before the crew leaves
A survey crew walking a ridge to check setbacks and sight lines is slow and weather-dependent, and most of the positions they check get ruled out anyway for reasons that were visible from above the whole time. An obstacle height map tells you which candidate positions are worth the crew's time and which ones you can cross off before anyone packs a truck.
Wind Farm Siting builds that terrain and obstacle layer from stereo VHR imagery, refreshed on an annual cycle, so a siting engineer can screen a whole ridge's worth of candidate positions and see which ones clear slope, roughness, and obstacle height before deciding where the met mast goes. If a ridge is worth a second look, the product page walks through how the screen works. Get in touch to run your next candidate ridge through it before you schedule the crew.