2 November 2026
Davenport roughness classification: what it is and why siting teams still use it
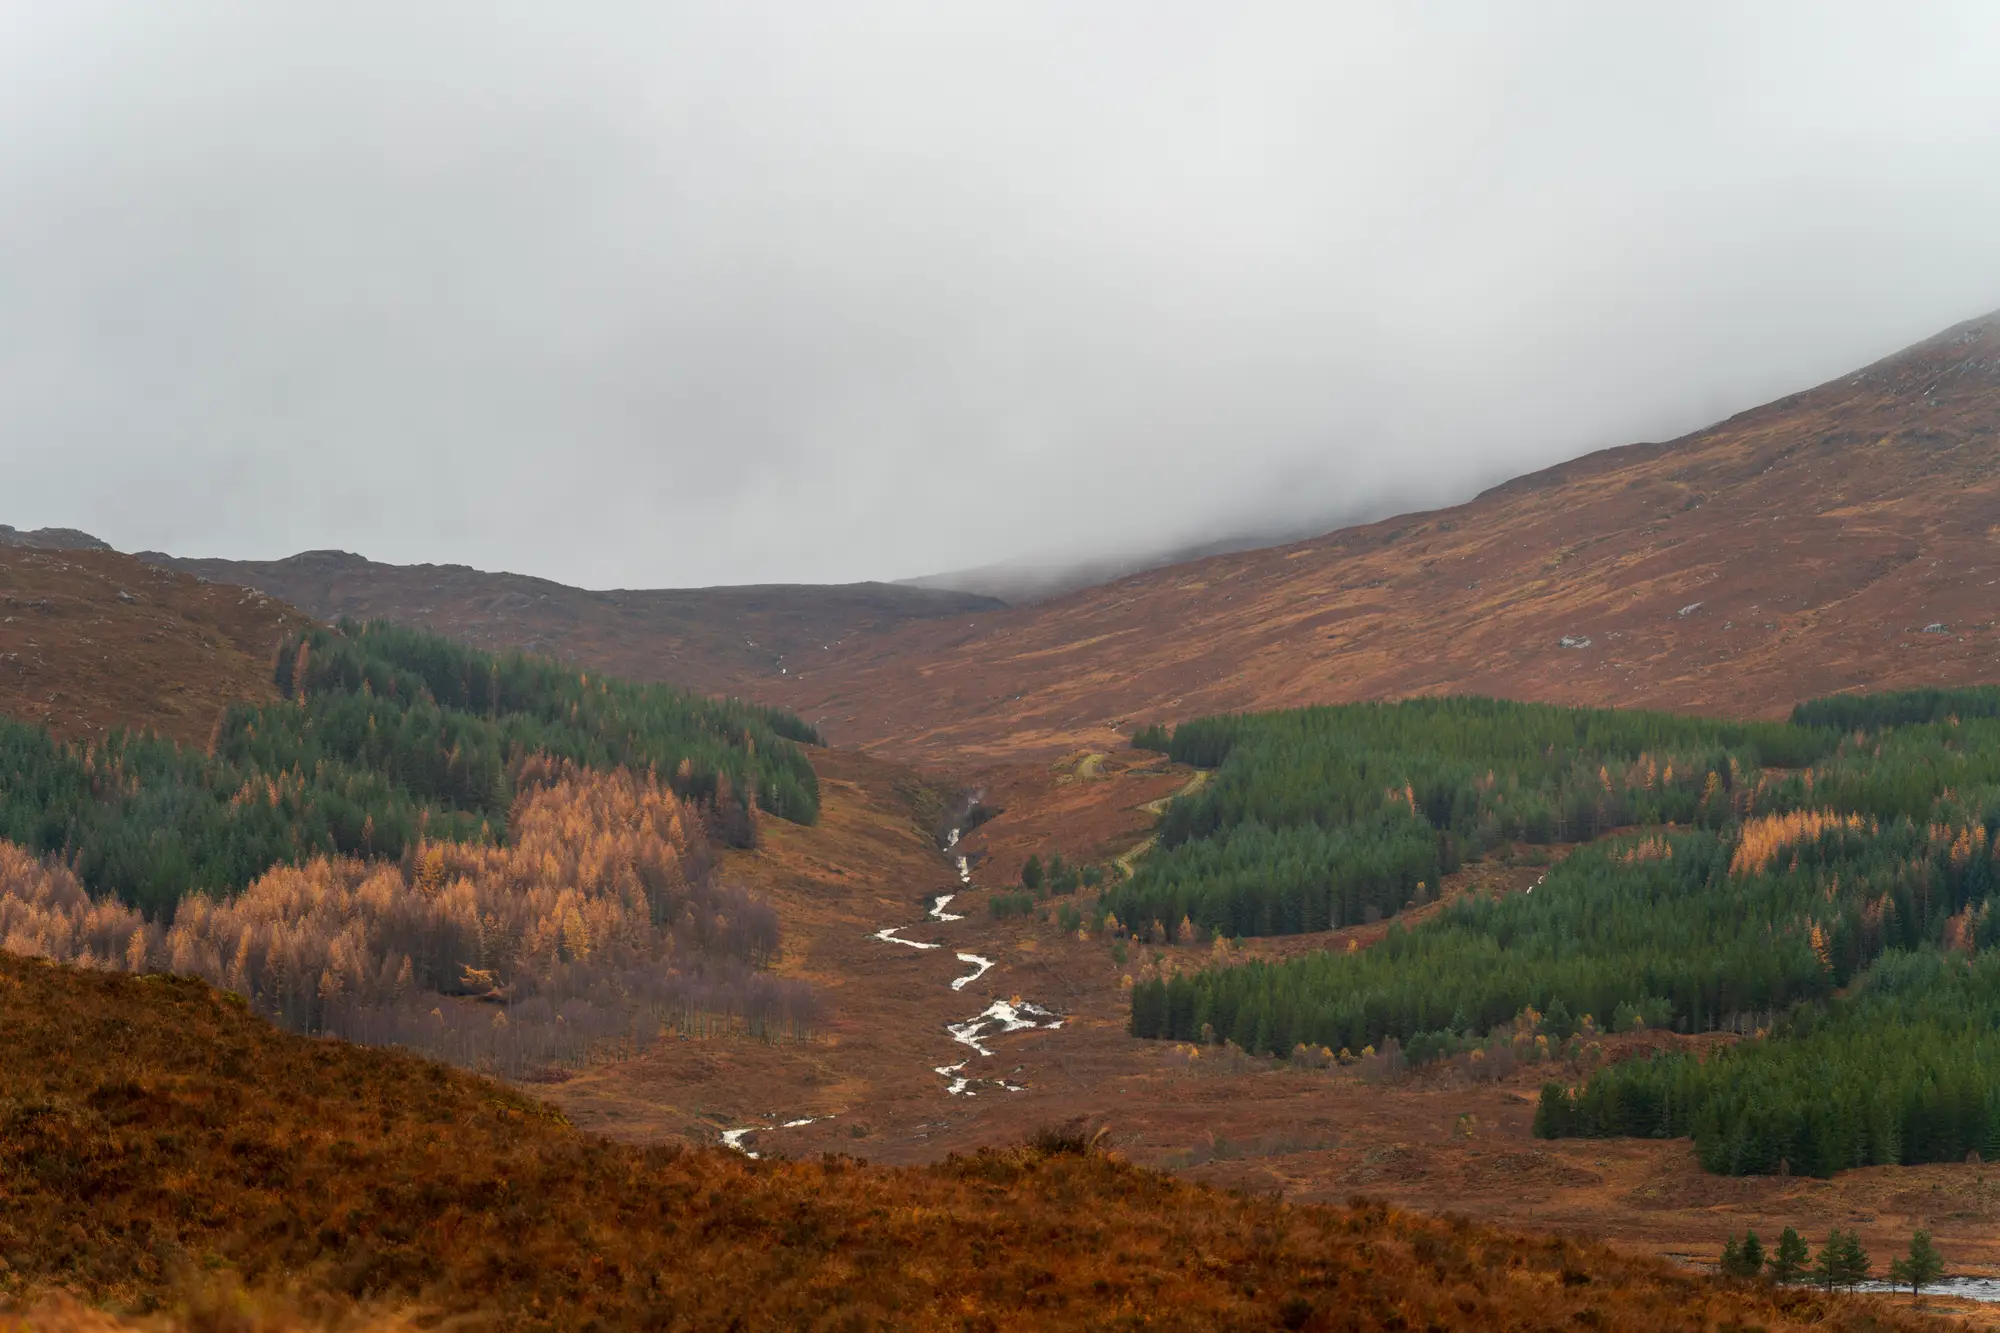
Open any WAsP map or a resource analyst's roughness rose and you'll find the same reference buried in the methodology: Davenport, 1960, later expanded by Wieringa in 1992. It's one of those pieces of wind engineering that predates modern software by decades and never got replaced, because nobody found a better shorthand for "how much does this ground slow the wind down."
What the classification actually sorts
The Davenport-Wieringa scheme assigns a roughness length, z0, to a type of land cover. Z0 is a fitting parameter, not a physical height you could measure with a tape: it's the height above ground where the logarithmic wind profile mathematically goes to zero, standing in for how much drag a surface puts on the boundary layer.
The classic table runs from open water at roughly 0.0002 m up through mown grass around 0.01 m, row crops near 0.1-0.25 m, scattered trees and hedgerows around 0.5 m, forest and dense low-rise suburb near 1-1.5 m, and city centers with high-rises above 2 m. Nine classes in the full Wieringa revision, each tied to a description you could stand on and recognize: "farmland with closed appearance," "regular large obstacle coverage," that sort of thing.
Resource analysts use it because WAsP and similar flow models need a roughness length to extrapolate measured wind speed at mast height up to hub height, and to propagate that speed across a site where the land cover changes from field to hedge to forest edge. Get the roughness class wrong on the upwind fetch and the shear exponent you feed into your energy yield estimate drifts, sometimes enough to matter in a bankable report.
Where the classification runs out of road
Here's where most siting engineers hit the limit of the table. Davenport classes describe land cover type, not terrain relief. A roughness length of 0.5 m for "scattered trees" tells you nothing about whether those trees sit on a flat plain or cling to a 30-degree ridge face where flow separates and recirculates on the lee side. Two sites can carry the identical roughness class and produce completely different turbulence behavior because one has slope and the other doesn't.
That's a real gap for ridge siting. A roughness class plus a contour line from a coarse DEM tells you the land cover and the elevation, but not the obstacle height sticking up out of that land cover, and not how steep the slope runs between two points a crew hasn't walked yet. You can assign class 4 to a ridge covered in scrub and still miss a line of mature trees or a rock outcrop that's going to dominate the local flow field right where you were planning to drop a mast.
Most teams patch this by combining the roughness table with a digital elevation model and whatever aerial imagery they can pull for the candidate ridge, eyeballing slope breaks and obstacle lines before committing a crew to a site visit. It works, but it's slow, and it still leans on a human squinting at low-resolution imagery to guess at tree-line height and slope gradient from a desk.
A faster first pass before the crew drives out
Deriving slope, surface roughness and obstacle height directly from stereo very-high-resolution imagery narrows that gap. Instead of assigning a single roughness class to a whole polygon of land cover, you get a terrain layer that flags the specific stretch of ridge where slope and obstacle height change, the stretch worth a met mast rather than the stretch a crew would have ruled out on arrival. Wind Farm Siting builds that ridge-by-ridge screen from satellite and aerial stereo imagery at 0.5 m resolution or better, refreshed annually per project, so the roughness table stays the starting point rather than the whole picture.
The Davenport classification isn't going away. It sits inside WAsP, inside every bankable resource assessment template, inside the shear calculations a lender's engineer expects to see in the report. What changes from project to project is how much terrain detail a siting team stacks on top of that class before deciding which ridge actually gets a mast.
If you've got a candidate ridge and a roughness table that doesn't quite settle the argument, that's exactly the gap Wind Farm Siting is built to close.